Most “Shopify CRO” articles are a list of 40+ tactics with no baseline to check them against and no way to tell which ones matter for your store. This one starts from the numbers: what a typical Shopify store actually converts at, where the funnel actually leaks, and a method for deciding what to fix first — before any list of tactics.
What “Shopify conversion rate optimization” actually means
Conversion rate optimization is the practice of increasing the share of store visitors who complete a purchase, without spending more on traffic to do it. For a Shopify store that means working the whole path a visitor takes — landing page, product page, cart, checkout — rather than treating checkout as the only lever. A CRO program that only touches checkout is optimizing the last 10% of a funnel that’s often losing people much earlier.
It is not the same discipline as SEO (which grows the number of visitors) or paid acquisition (which grows visitors at a cost). CRO makes the visitors you already have more likely to buy, which is why it’s usually the highest-ROI lever available to a store that already has meaningful traffic and a conversion rate below its category norm.
Current benchmarks
Benchmarks exist to tell you whether a number is a problem, not to be a target in themselves — your own trend, segmented correctly, matters more than any external average. With that caveat:
- 1.4% is the average conversion rate across roughly 2,800 Shopify stores in Littledata’s Shopify Benchmark report — still the most frequently cited Shopify-specific figure as of this writing. Stores above 3.2% sit in the top 20%; above 4.7% puts a store in the top 10%.
- Desktop converts meaningfully higher than mobile — Littledata’s data puts desktop around 1.9% against roughly 1.2% on mobile, even though mobile now carries the majority of Shopify traffic. A store that is “mobile-heavy and underperforming” is often just under-optimized for the device most of its visitors are actually using.
- Category variance is large. Third-party aggregations of Shopify benchmark data show ranges from well under 1% (considered, low-urgency categories) to 5%+ (impulse, low-price categories like arts & crafts). These aggregated per-category figures come from a mix of sources of varying rigor — treat them as a rough sanity check against your own GA4 data, not a precise target.
- Cart abandonment averages 70.22% across 50 studies compiled by the Baymard Institute — the most-cited primary research on this number. Roughly 42% of documented abandonment is browsing behavior, not checkout failure; of the remainder, the leading causes are extra costs revealed late (40%), forced account creation (18%), security concerns about entering payment details (19%) and slow delivery estimates (20%).
- Add-to-cart rate and checkout completion — Littledata’s benchmark puts the average Shopify add-to-cart rate around 4.6% and checkout completion (of visitors who reach checkout) around 45%. Both are useful mid-funnel checkpoints — see the diagnostic funnel below.
Sources: Littledata Shopify Benchmark, Baymard Institute, “50 Cart Abandonment Rate Statistics” (updated September 2025).
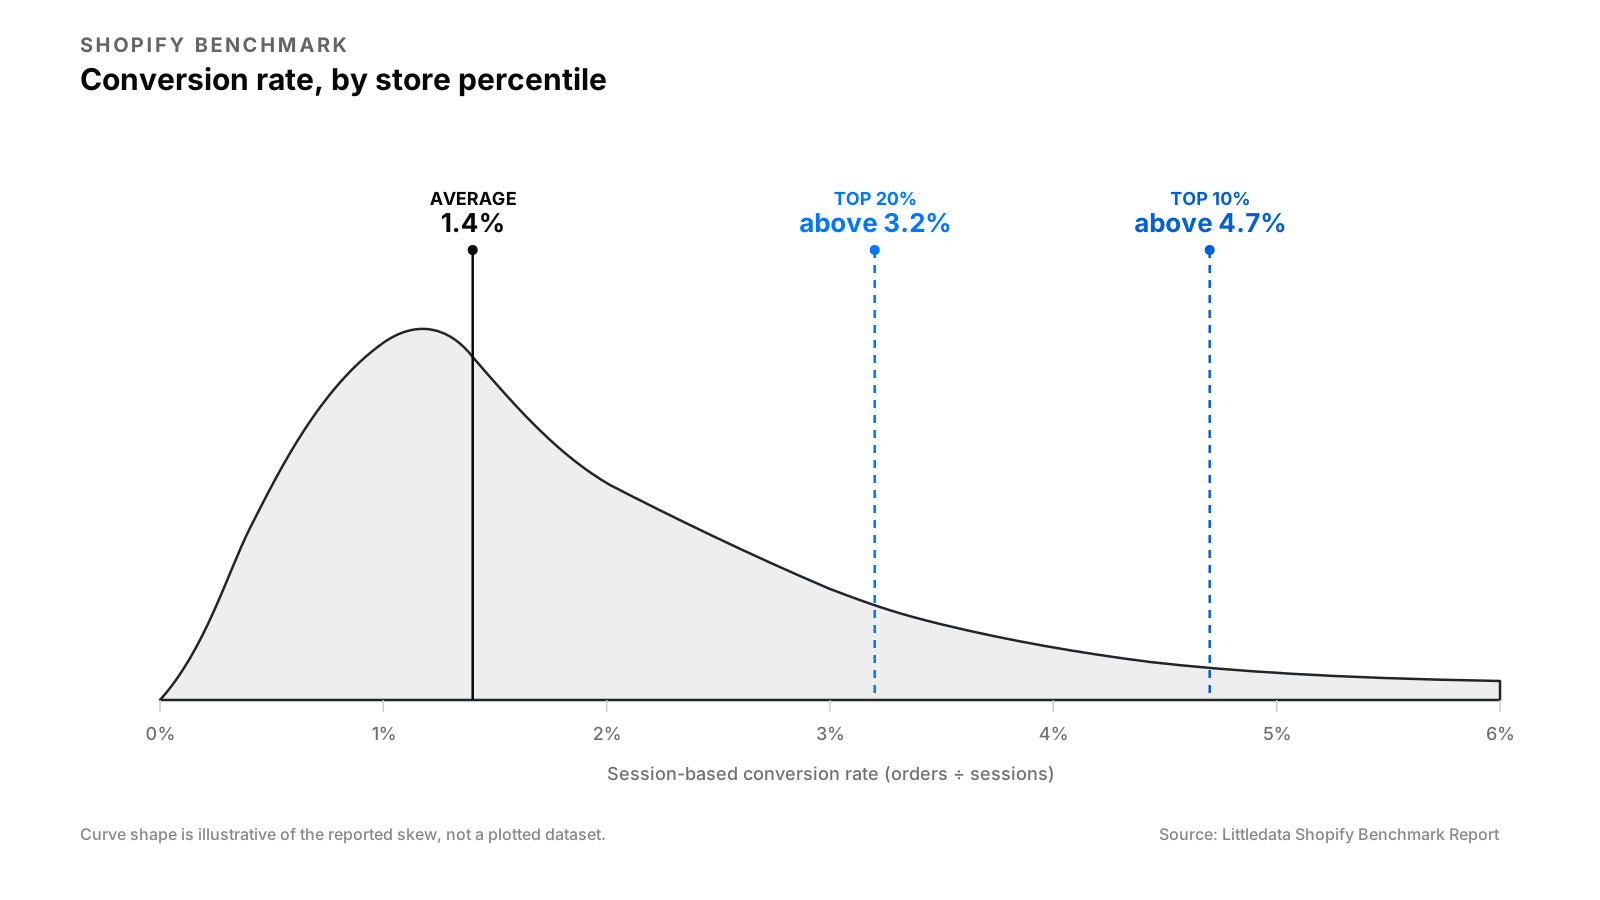
Chart — Shopify conversion-rate distribution by percentile, with the 1.4% average and the 3.2%/4.7% top-quartile/decile benchmarks marked. Source: Littledata Shopify Benchmark Report.
How to calculate your conversion rate correctly
The most common measurement mistake is comparing an unfiltered number to a benchmark that filtered its own. Before you compare yourself to anything above:
- Filter bot and crawler traffic. GA4 does some of this automatically; Shopify’s own analytics does not fully. A spike in “sessions” with no matching order activity is usually not a marketing problem.
- Decide session-based vs. user-based, and be consistent. Session-based conversion rate (orders ÷ sessions) is what most benchmarks report; it will read lower than a user-based rate for stores with a lot of return visits before purchase.
- Segment new vs. returning visitors separately. A blended rate hides the fact that these are two different funnels with different baselines — returning-visitor rate is often 2–4x the new-visitor rate, and averaging them together makes neither number actionable.
- Segment by device and by channel. Paid social traffic, organic search traffic and email traffic convert at different rates for structural reasons (intent, not creative quality), and blending them into one number makes channel decisions harder, not easier.
- Exclude test orders and staff purchases if your store processes either through the live storefront rather than a Shopify draft order.
The diagnostic funnel
Every Shopify store’s purchase path breaks down into the same five stages. Pull your own numbers for each before deciding what to work on:
- Landing → product view. Are visitors reaching a relevant product, or bouncing off a page that doesn’t match what brought them there?
- Product view → add to cart. Benchmark reference: ~4.6% of all sessions. If your product-page-to-cart rate specifically is low, the product page itself (imagery, price clarity, availability, trust signals) is usually the first place to look.
- Add to cart → begin checkout. This is where cart-page friction shows up — surprise shipping costs, no visible discount field, no guest option.
- Begin checkout → complete purchase. Benchmark reference: ~45% checkout completion, ~70% cart abandonment overall. This stage is where Baymard’s reasons list (extra costs, forced accounts, security concerns, delivery speed) does the most damage.
- Purchase → repeat purchase. Outside the scope of a CRO audit strictly defined, but worth tracking alongside it — a store that converts well on the first visit and never sees a second one has a retention problem CRO tactics won’t fix.
Run your own numbers through this funnel before opening any tactics list. A store leaking 60% of its traffic between landing and product view has a different problem, and a different fix, than one losing people at checkout.
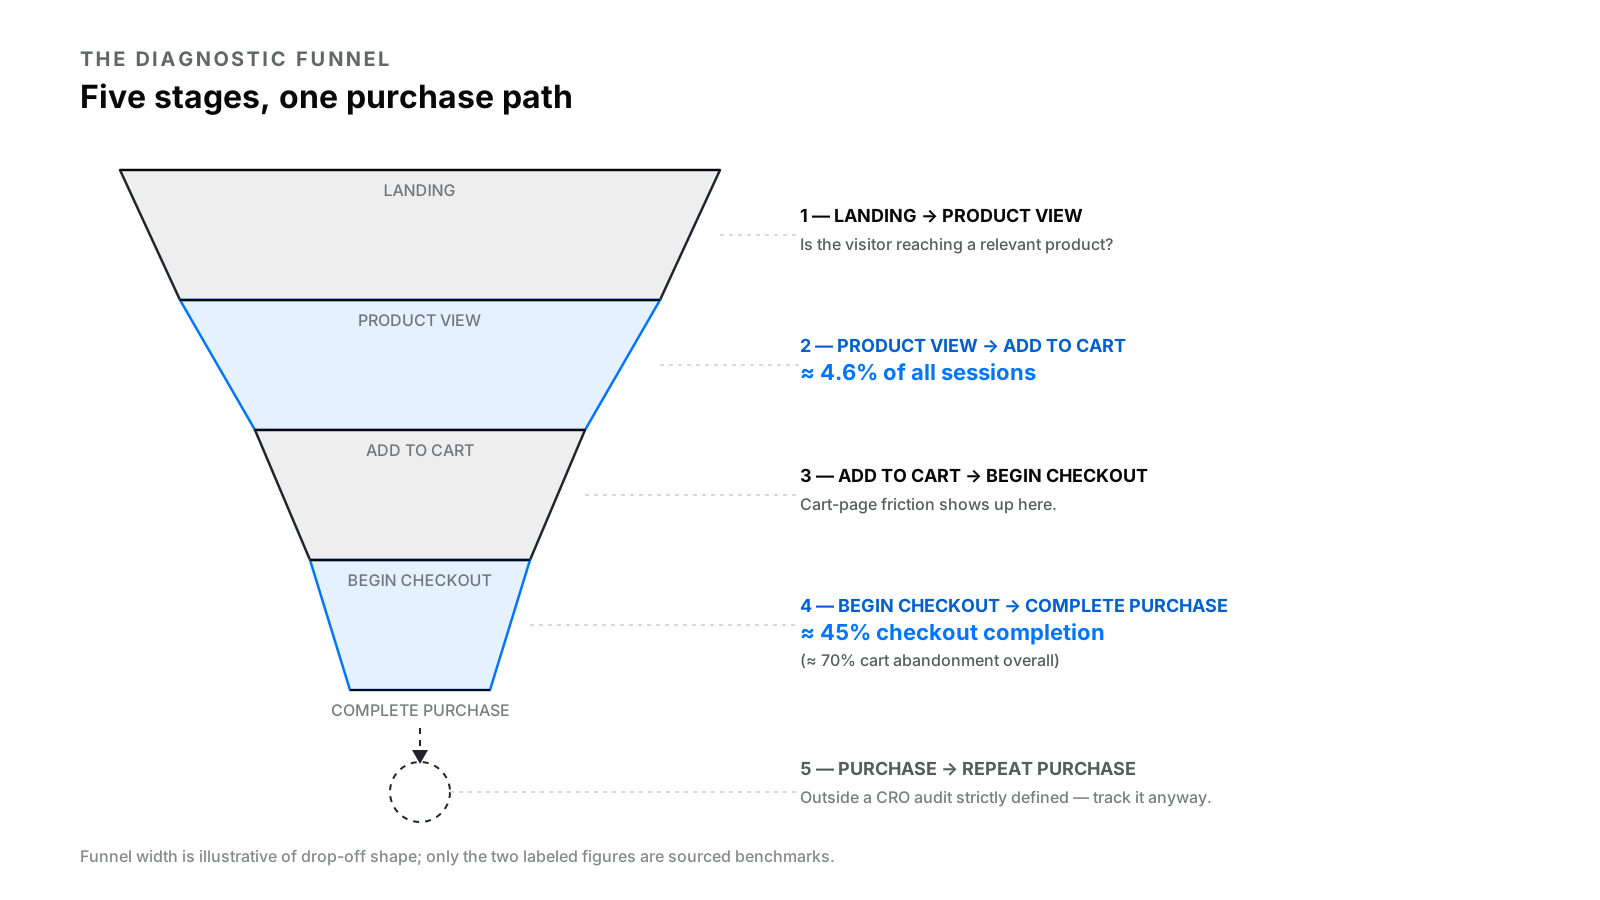
Diagram — the five-stage purchase funnel above, annotated with this section’s benchmark figure at each stage.
Running a prioritized CRO audit
An audit that produces a list of “everything that could be better” is not useful — everything can always be better. A useful audit produces a ranked list. The standard method, borrowed from product prioritization and adapted for CRO:
- Pull funnel data for all five stages above, segmented by device and by new/returning.
- List every observed friction point — from analytics drop-off, from session replay, from a manual click-through of your own checkout on mobile.
- Score each one on Impact, Confidence and Ease (ICE) — a 1–10 estimate of how much it likely affects conversion, how confident you are in that estimate given the data, and how cheap it is to fix. Multiply the three; work top-down.
- Separate “known problem” from “hypothesis to test.” A friction point backed by funnel data and session replay (e.g., 30% of mobile checkout sessions abandon on the shipping-method step) is a known problem — fix it. A friction point backed by intuition alone (“our product photos probably aren’t good enough”) is a hypothesis — it belongs in the A/B testing queue, not the fix-it-now list.
This is the structural difference between an audit and a tactics list: an audit tells you which of the tactics below are actually worth your time on your store.
Tactics by journey stage
Landing pages
- Match landing-page headline and imagery to the specific ad or search query that brought the visitor — mismatched intent is a bounce, not a conversion problem to A/B test.
- Keep the primary CTA above the fold on mobile specifically; mobile viewport height makes this a common miss.
Product and collection pages
- Lead with the information that resolves the buyer’s actual hesitation for your category — sizing and fit for apparel, ingredients for consumables, compatibility for accessories — rather than a generic “add to cart” push.
- Show real stock/availability status rather than letting an out-of-stock click surprise the visitor at cart.
- Put shipping cost and delivery window estimates on the product page, not first-revealed at checkout — this directly targets Baymard’s #1 abandonment cause.
- Use collection-page filtering that reflects how your customers actually shop (by use case, by size, by price band), not just your internal product taxonomy.
Cart page
- Show a running total that includes estimated shipping and tax before checkout, where regionally possible.
- Offer guest checkout as the default path, not an easy-to-miss link — forced account creation is Baymard’s #2 documented cause of abandonment.
- Make the discount code field visible without adding friction for shoppers who don’t have one.
Checkout
- Minimize the number of steps and fields; every optional field is a chance to abandon.
- Surface security and payment-method trust signals (recognizable logos, SSL indicators) near the payment step specifically, where the hesitation Baymard measures actually occurs — not just in the footer.
- Offer the payment methods your specific customer base expects (Shop Pay, PayPal, Apple Pay, buy-now-pay-later where relevant to your AOV and category).
Speed, mobile and accessibility
- Treat mobile as the primary design target, not a scaled-down desktop layout — it is the majority of Shopify traffic and converts at roughly two-thirds the desktop rate, which is itself partly a design-quality gap, not just an inherent behavioral difference.
- Page speed affects conversion directly and also affects paid-traffic cost through ad platform quality scores — a slow product page is a tax on both organic and paid acquisition.
- Accessible forms (proper labels, visible focus states, sufficient contrast) reduce checkout abandonment for a meaningful share of visitors and are table stakes, not a nice-to-have.
CRO tools, and when each one actually applies
No single tool covers this whole list — match the tool to the question you’re actually asking:
- Behavioral analytics / session replay (e.g., Hotjar, Microsoft Clarity) — for watching how visitors move through a specific page, useful for generating hypotheses about a stage your funnel data says is leaking.
- A/B testing platforms (e.g., Shopify’s native tools for eligible plans, or third-party platforms like VWO, Convert, Intelligems) — for testing a specific hypothesis against a control, once you have enough traffic to reach significance (see below). Running an A/B test without enough traffic produces a false result, not an inconclusive one — know your minimum before you start.
- Web analytics (GA4, Shopify’s own analytics) — for the funnel measurement itself; this is where the numbers in the diagnostic funnel section come from.
- Page-speed tooling (PageSpeed Insights, WebPageTest) — for diagnosing whether speed is a plausible contributor before treating it as one.
- Voice-of-customer (post-purchase surveys, cart-abandonment surveys) — for the reasons behind a drop-off that analytics alone can’t explain, and the most direct way to check whether your store’s abandonment reasons actually match Baymard’s industry-wide list or diverge from it.
A/B testing methodology and sample size
The industry-standard test configuration — used by default in Optimizely, Adobe Target and most major platforms — is 95% statistical significance and 80% statistical power. Below that, you’re more likely to act on noise than on a real effect.
What this means practically for a Shopify store:
- Required sample size depends on your baseline conversion rate and the minimum lift you want to detect. A store converting at 1.4% needs a substantially larger sample to detect a 10% relative lift than a store converting at 4%, because the baseline event (a purchase) is rarer. Use a sample-size calculator with your own baseline rate before committing to a test — don’t estimate test duration from traffic volume alone.
- Low-traffic stores often cannot reach significance on individual page-level tests within a reasonable window. If your monthly order count is in the low hundreds, sequential before/after testing with a clear before-period baseline (not a true A/B split) may be the more honest approach than running an underpowered test and calling a coincidence a win.
- Statistical significance is not the same as practical significance. A confirmed 0.3-percentage-point lift might be real and still not worth the engineering cost of a permanent implementation — factor implementation cost into the prioritization, not just the test result.
- Don’t call a test early because it crossed significance on day 3. Day-of-week and traffic-source mix change across a full purchase cycle; a pre-committed minimum test duration (typically at least one full business cycle, often 2–4 weeks for Shopify stores) protects against this.
A 30/60/90-day roadmap
- Days 1–30: measure and audit. Instrument the five-stage funnel correctly (session vs. user based, segmented by device and visitor type), run the ICE-scored audit above, and fix the highest-confidence known problems that don’t require a test to justify — a checkout field you already know is unnecessary doesn’t need an A/B test to remove.
- Days 31–60: test the top hypotheses. Take the highest-scored hypotheses (not known problems) from the audit into properly-powered A/B tests, sized against your actual baseline conversion rate and traffic.
- Days 61–90: implement, re-measure, and set the next cycle. Ship winning tests, re-run the five-stage funnel measurement to confirm the lift actually moved the number you targeted (not just the metric you tested), and re-score the remaining backlog — new data from the last 60 days will have changed some of those ICE scores.
An audit checklist to work from
- Funnel numbers pulled for all five stages, segmented by device and by new/returning visitor
- Session vs. user-based conversion rate defined and used consistently
- Bot/crawler traffic filtered from the baseline
- Shipping cost and delivery estimate visible before checkout, not first-revealed there
- Guest checkout available as the default path
- Discount code field visible without added friction
- Security/trust signals present specifically near the payment step
- Mobile checkout walked manually, end to end, on a real device
- Page speed checked on product and checkout pages specifically
- Every friction point logged and ICE-scored before being called a fix or a test
When it’s worth hiring a CRO agency
Handle it in-house if your team has the analytics access, the traffic volume to reach test significance in a reasonable window, and the engineering time to actually ship winning changes — CRO backlogs that never ship are a common failure mode independent of the analysis quality.
Bring in outside help when any of these is true: your team can diagnose problems but the fixes queue behind other engineering priorities indefinitely; your traffic doesn’t clear the threshold for reliable A/B testing and you need someone experienced in sequential-testing judgment calls instead; or a fresh, structured audit is worth more than another internal opinion because everyone close to the store has stopped seeing its friction points. Vibhora’s Website & App Audit is built around exactly the diagnostic method in this article — funnel measurement first, ranked findings second, no fix proposed without the data behind it.
FAQs
What’s a good Shopify conversion rate?
There’s no single good number — category, price point and traffic mix all shift the baseline meaningfully. As a rough anchor, Littledata’s benchmark puts the Shopify-wide average at 1.4%, with the top 20% of stores above 3.2%. Compare your own segmented, correctly-measured rate against your own trend and your specific category first.
How long should I run an A/B test before calling a winner?
Long enough to clear a pre-calculated sample size for your actual baseline conversion rate and desired minimum detectable lift, and long enough to cover at least one full business cycle so day-of-week and channel-mix variance doesn’t distort the result — commonly 2–4 weeks for a mid-traffic Shopify store, longer for lower-traffic ones.
Can I run a reliable A/B test on a low-traffic store?
Not always. If your order volume can’t reach statistical significance within a reasonable window, sequential before/after testing with a clean baseline period is often more honest than an underpowered split test.
Where should I start if I don’t have time to fix everything at once?
Run the five-stage funnel measurement first. Whichever stage is leaking the most relative to benchmark is where the highest-impact, highest-confidence fixes are most likely to be — start there, not at the top of a generic tactics list.
Does page speed actually affect conversion, or is that overstated?
It affects it directly, and it also affects paid-acquisition cost through ad-platform quality scoring — a slow product or checkout page is a compounding cost, not a one-time issue worth deferring.
Written by Vibhora
Design-first, performance-focused Shopify development, migrations and optimization for ambitious brands.